Food poisoning

Food poisoning, also called foodborne illness, is an infection or irritation of the digestive tract that can spread through food or drinks. Viruses, bacteria, and parasites cause most food poisoning. Harmful chemicals may also be a contributor ( source: NIH ). Food poisoning was first identified as a public health issue in the 1880s.

When two or more people get the same illness from the same contaminated food or drink, the event is called a foodborne outbreak. The Centers for Disease Control and Prevention began tracking these outbreaks in the 1970s.

Some states count a higher number of outbreaks than another as shown in the map below.

Foodborne outbreak data are provided for 1998–2017.
Source: National Outbreak Reporting System

The story of Chicago

A story about the most populous city in the U.S state of Illinois, one of the most concerned states by foodborne outbreak.
Data from Chicago Open Data


Repartition of Chicago food facilities.
Source: Chicago Open Data

Chicago is home to more than 20,000 food establishments like restaurants, grocery stores, bakeries, and more. In order to prevent the spread of food-borne disease, inspections are periodically performed by a team from the Chicago Department of Public Health’s Food Protection Program (Source: Chicago Goverment).

  • 2 main types of inspections were considered: Routine Health Inspections (canvas) and Complaint- Based Health Inspections (complaints and inspections due to food poisoning).
  • The frequency of these inspections is based on the risk level assigned to the establishment. This risk depends on the types of food prepared and the methods used for preparing and serving the food. In general, risk 1 establishments are inspected twice per year, risk 2 establishments once per year, and risk 3 establishments every other year.
  • An inspection can pass, pass with conditions or fail (source: Chicago Government).

The pie charts below illustrate the repartition of each of the introduced characteristics.

Between 1940 and 1960, the amount of mail doubled in The United States. In 1963, the Zone Improvement Plan divided the country into ten regions and assigned 5 digits increasing in specificity, from region to large sorting centers. The two first digits associated with city of Chicago zip code are 60. The 3 last digits are specific to post offices or delivery areas. For data analysis, the ZIP Code Tabulation Areas (ZCTAs) are often used instead of postal zip codes. These are approximate area representations of U.S. Postal Service (USPS) ZIP Code service areas that the Census Bureau creates to present statistical data from Census.

ZIP codes divisions can be helpful for visualizing spatial inequalities in Chicago. As each zip code has a different number of facilities, one needs to remove this bias. To do so, we will normalize the facilities count as follows: definition of proportion: #facilities with feature (i) per zip code / #total facilities per zip code.

Inspections and food poisoning

The Model Food Code developed by the U.S. Food and Drug Administration (FDA) has been adopted by many States with respect to inspection practices and report forms. Many jurisdictions now make inspection results available online, allowing consumers to view the results when considering where to dine.

But the extent of how useful this information will be to reduce the risk of food-borne illnesses is still unknown.

Is there a link between the inspections' features and food poisoning?

This factor is reflected by the risk level attributed to each facility. More than 80% of the facilities inspected for suspected food poisoning are associated with a high risk level. Also, almost none of them are associated with a low risk level which shows the consistency of this risk scale.

The risk

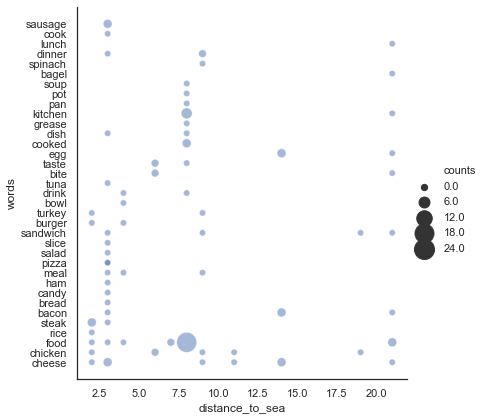
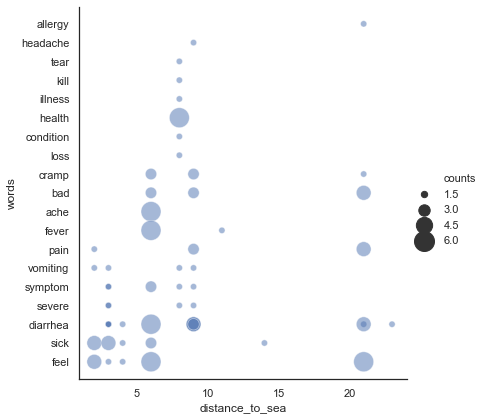
Some foods are more at risk of bacterial growth than others. Therefore, if they are not correctly cooked, there is a higher chance that they might cause a food-borne illness. Using the dataset National Outbreak Reporting System, one can point out the foods that cause the highest number of food-borne illnesses.

The map below shows the proportion of facilities associated with a high risk level for each zip code.

Proportion of facilities associated to a high risk level for each zip code.
Source: Chicago open data

In order to investigate the link between the risk level and food-borne illnesses, we decided to visualize the relationship between the proportion of facilities associated with a high risk level and the proportion of food poisoning within a zip code.

Curiously, even if the area associated with the zip code 60827 (marked in the plot) has the lowest proportion of high risk facilities, a large amount of inspections due to food poisoning can be observed. The 60827 zip code is associated with a community called Riverdale. Riverdale is one of the hardest neighborhoods in the city and is considered as one of the most dangerous communities. It is known to struggle with high unemployment, poverty and gang violence.

The Chicago Community Area of Riverdale includes Altgeld Gardens, a public housing development once dubbed Chicago's toxic doughnut due to having the highest concentration of hazardous waste sites in the nation (source). Therefore, the large amount of inspections due to food poisoning reported in this area could be explained by water contamination. In fact, water contamination leads to a poor cleanliness (contaminated cooking tools, food..) which may increase the poisoning cases even though the facilities have safe food preparation habits. Thus, Riverdale could be considered as an outlier. After removing this outlier, a Spearman's correlation was run to determine the relationship between the proportion of facilities associated with a high risk level and the proportion of inspections due to food poisoning. There was a weak, positive monotonic correlation between these two parameters reflected by a significant coefficient equal to 0.4 (n = 51, p < 0.05).

Violations

Each violation have a number which refers to a particular category. The Chicago Food Reporting Inspection System distinguish between 3 type of violations.

  • From 1 to 14 : Priority (P) Violations, which are critical can create an immediate health hazard that carries a greater risk of causing food-borne illness. The facility needs to correct immediately this kind of violation during the inspection otherwise the license business is suspended.
  • From 15 to 29 : Priority Foundation (FP) Violation, which are serious can create a potential health hazard. If not immediately corrected , the inspection fails.
  • From 30 to 44 + 70 : Core Violation (C), which are minor do not pose an immediate threat to the public’s health.
The inspections that were made due to suspected poisoning shows a higher frequency of priority and priority foundation violations.

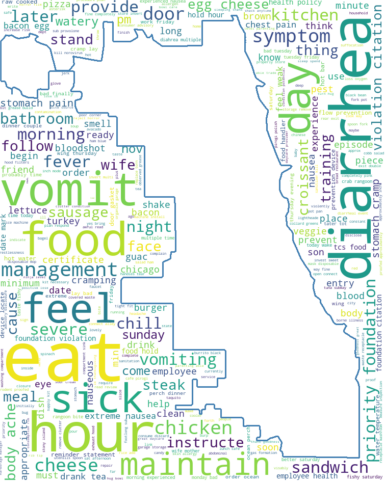
The size of the bubbles reflects the ratio between the frequency of violations associated with food poisoning inspections and the frequency of violations with other kind of inspections (canvas and complaints). The plot shows the most frequent violations commited during food poisoning inspections.
Yellow: Core violations, Orange: Priority foundation, Red: Priority violations. Source: Chicago open data

The seaside

Looking at the US outbreak map or the following map, we can observe a more frequent food poisoning cases by the seaside.

Average number of inspections for food poisoning per zip. Each to refers to a particular inspection. A high density can be observed near the sea. Source: Chicago open data

Is there a correlation between food poisoning and the facility distance by the sea?

The correlation between the food poisoning frequency within a zip code and the distance from the city center is a moderate, negative monotonic correlation reflected by significant coefficient equal to -0.44 (n = 51, p < 0.05). The correlation between the food poisoning frequency within a zip code and the distance from the sea is also a moderate, negative monotonic correlation reflected by significant coefficient equal to -0.53 (n = 51, p < 0.001).

Looking at the plot above, we can conclude that the further the distance from the sea, the less food poisoning cases are encountered.

What could explain these observations?

Escherichia coli is a bacteria located in the intestines of humans and causes food poisoning illnesses. A major source of E.coli infections is undercooked beef. Other sources include drinking or swimming in water that is contaminated by sewage. E. coli bacterium, which is present in stool, can be passed from person-to-person as a result of improper hygiene or handwashing practices. People can become infected when a contaminated city or town water supply has not been properly treated with chlorine or when people accidentally swallow contaminated water while swimming in a lake, beach, or irrigation canal.

The Chicago Park District issued swim advisories at beaches along Chicago's Lake Michigan lakefront based on E. coli levels. The US Environmental Protection Agency (USEPA) recommends notifying the public when E. coli bacteria levels are above the federal water quality Beach Action Value (BAV), which is 235*CFU. Using data showing predicted E. coli levels in Chicago beaches water based on an experimental analytical modeling approach, we can try to detect if some beaches are particularly contaminated.

Poison concentration with markers for e-coli levels in the seawater. Red: the e-coli concentration exceeds more than 30 times the BAV, Orange: the e-coli concentration exceeds more then 11 times the BAV, Blue: the e-coli concentration exceeds at most 11 times the BAV. (Source: Chicago open data, Beach e-coli levels).

In general, a high e-coli predicted concentration (more than 11 times above the BAV) seems to correlate with a high proportion of food poisoning (> 4%), as it can be seen in the following zip codes: 60660, 60640, 60611, 60605, 60616. On the other hand, a relative low e-coli predicted concentration (less than 11 times above the BAV) seems to be correlated with a low proportion of food poisoning (< 4%) as observed in the zip code 60653 and 60626. However, even if they have green spots, the zip codes 60614, 60610 and 60637 have proportion of food poisoning higher than 4%. This could be explained by the fact that the zip codes 60614 and 60610 have a high number of facilities associated with a high risk (more than 83%). The zip code 60637 have a moderate number of facilities associated with a high risk, thus it seems to be an exception.

A possible cause of such a correlation (e-coli and food poisoning cases) could be that when people swim at the beach, they could swallow water contaminated with E.coli and develop the symptoms. If they swim and then go to a food facility they might contaminate the environment and increase the risk of bacteria propagation within the restaurant or grocery store.

«Report food poisoning - Protect others»

In order to have a better insight on food poisoning in Chicago, we decided to analyze real consumers’ complaints. Patrick Quade, who had no prior experience within the restoration fields when he started the IWasPoisoned website. He was working in finance in New York City when one day, he had a bad expierence in a facility that ignored his complaints. Furious, he decided to create an online platform to report food poisoning. People self-report suspected foodborne illnesses after dining in a specific facility. Details are given on the time and date, the food ordered, and even the symptoms of the experienced sickness. This way, the website has a track record of accurately spotting illness outbreaks even before health officials or restaurants. In 2017, information gathered from his users helped identify the norovirus outbreak at Chipotle restaurants (Source: Livescience).

Using approximately 200 posts from the website IWasPoisoned we constructed a word cloud to represent the most frequent words.

One may notice that words describing frequent symptoms of food-borne illnesses such as ‘diarrhea’, ‘fever‘ and ‘vomit’ are highly present in the complaints. Some words also give insight on the types of food ingested before the illness. As seen in the pie chart above, food poisoning is commonly caused by undercooked chicken .

Thanks to the lexicon, the words will be distributed into 2 categories: Food and Symptoms.
Since the proximity to the sea is suspected to play a role in food poisoning due to E.coli infections, we plot the frequency of the words from these categories with respect to the distance to the sea.

Food
Symptoms

Predicting food poisoning

We trained and tested a couple of machine learning models to predict the inspections due to food poisoning cases. We believe that this could be an efficient way to identify restaurants that might promote the spread of food-borne illness with high risk of poisoning for the population. This will alert Chicago health care department about these restaurants, and encourage them to act accordingly, by re-inspecting the facility for instance. The features will mainly include: The list of violations committed during the inspection, the location (zip code), the risk factor of the restaurant, and the result.

The problem: Unbalanced dataset

After running two different binary classification models, we were able to reach an accuracy of more than 99%. However, a further analysis revealed that the class is extremely unbalanced, with the negative value corresponding to over 99% of the data. Furthermore, we discovered that the model is completely inefficient at predicting food poisoning cases, and rather maximizes the accuracy by classifying each of the inspections as non-related to food poisoning.

Solution

We trained an XGBoost classifier to handle this class, which is an extremely boosting algorithm based on trees and built to enable handling of unbalanced datasets. We used the F1 score as a metric of performance as well as the ROC-curve to select the best model. We also made use of a score that we created based on the violations frequency during food poisoning inspections. The more frequent a violation is, the higher the associated weight.

Performance comparison

We could identify way more accurate cases related to Food Poisoning (True Positives), and we conclude that the second model is more suitable for classifying correctly these rare cases. This however involves a fairly large loss of overall accuracy and the model tends to classify more frequently cases of non-food poisoning as such.

However, even if we tried to improve the model, the area under the ROC curve is too low to conclude that we can predict food poisoning based on these features (AUC = 62%, knowing that when AUC is 0.5, it means a model has no class separation capacity whatsoever).

Additional data regarding food poisoning inspections can be of help for coming up with better models, as well as better features. Another limitation of the final model is the score built on intuition and some evidence, which could introduce some bias in the predictions.

Guidelines

In a nutshell, by studying the data set from the food inspections with care, we have found various related factors and attempted to predict which restaurants will cause food poisoning. The results were not convincing enough to insure the precision of these predictions. However, thanks to various platforms on the internet, it is still possible to avoid people from being sick!

Here is a guideline that could be helpful for a consumer in Chicago:

  • Do not trust the inspection results of the facility. A facility that passed the inspection might still cause food poisoning.
  • Be careful when ordering meat dishes. Various sickness arise from uncooked meat such as chicken.
  • Report any food poisoning on online platforms such as iwaspoisoned.com. It may discourage other people from going to the same restaurant.
  • Report food poisoning to the health officials to avoid an outbreak.

Guidelines for a food business:
Give extra care to the hygienic measures and cooking methods. Be more pre-cautious if:

  • The risk of your facility is high.
  • If the facility is located near the sea.